Want to boost the ROI of your e-commerce store? Make performance analysis the ultimate priority for data-driven decisions!
Most e-commerce businesses get lost in the deep sea of data, failing to measure the progress and operation of the store. But you won’t face the same with Reportgenix—a powerful tool designed to streamline and enhance your performance analysis!
Whether you want a targeted report or overview of your overall store performance – Reportgenix covers it all! It brings you custom reports, automated scheduling, advanced filtering, and many more attractive features for performance analysis. Besides, AI and third-party app integration will take your report analytical experience to the next height!
Let’s explore how to use Reportgenix for E-commerce store performance analysis and unlock the full potential of your business-
What Is E-Commerce Store Performance Analysis?
E-commerce performance analysis refers to examining data to understand how your online store is performing. It involves tracking your store’s performance, such as traffic, engagement, profit, conversion, and sales rate.
By analyzing this data, you get a review of your online store’s performance. However, manual analysis is time-consuming and inaccurate. So, using performance analysis apps can give you a quick and reliable solution!
These apps categorize your daily, monthly, or yearly sales. Thus, they give an organized overview of your e-commerce business. You can also note down your best-selling products. They further help you track customer behavior.
This helps you improve, identify your business’s strengths/weaknesses, and make better decisions to boost ROI.
Why Is Performance Analysis Important For E-Commerce Store?
Performance analysis of the progress of your e-commerce store. The major benefits it brings include-
- Understanding customer behavior
Performance analysis allows you to track your store’s popular products. It also gives you an idea of user experience and navigation flexibility. You can further identify what influences your customers’ decision-making.
Thus, it guides you to launch more impactful product offerings, promotions, and website layouts for customer satisfaction.
- Optimizing marketing strategy
You can measure the effectiveness of your marketing campaign in different channels through performance analysis. It gives you a clear view of which channels bring the most traffic and conversion rates. Later, you can invest more in those specific sectors to maximize ROI.
- Improving user experience
With a performance analysis of your e-commerce store, you can identify your website’s drawbacks. Track where customers are facing issues, such as difficult navigation, slow loading, or confusing layouts.
Addressing these issues can help you offer a smoother and better user experience to your customers. This will eventually increase your conversion rate and reduce your bounce rate.
- Identifying trends and opportunities
Monitoring your store’s performance helps you identify emerging trends in customer behavior. You can track market demand, launch new product categories, or offer sales on popular items.
Thus, it opens up the opportunity for expansion, and your store stays ahead of competitors.
- Cost management
You won’t get the same response from all channels. So, dividing the investment is essential to ensure cost efficiency. Performance analysis shows you where the maximum sales are coming from.
Thus, you can make more targeted investments. This further allows you to identify areas to reduce costs without sacrificing customer satisfaction.
- Revenue growth and profitability
Tracking profit is easy with performance analysis apps. With a click, you can get profit data by product, month, discount, and other criteria. Thus, it allows for better inventory management and sales strategies.
Why Use Reportgenix For E-Commerce Store Performance Analysis?
Reportgenix is designed for in-depth performance analysis of your ecommerce store. It makes your online business management, marketing, and decision making quick and effective.
Here are some prominent features of the app for which you should use it for e-commerce store performance analysis-
- User-Friendly Interface
Using Reportgenix is super easy; even a newbie can use this app without any difficulty. You just need to download and install the app in your store, and you can operate it directly from the dashboard.
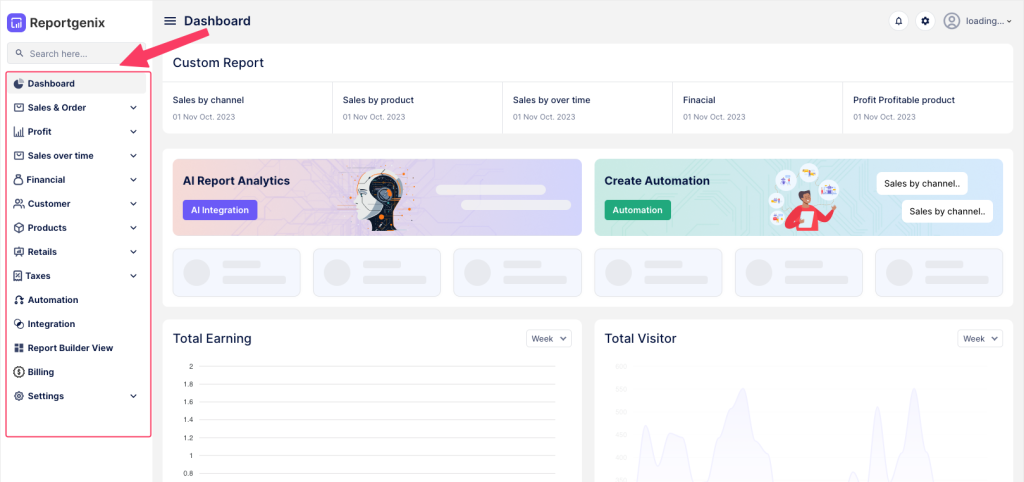
The left sidebar provides all the criteria for analyzing your store’s performance. It includes sales and orders, profit, finances, marketing, integration, and more.
All of these come with dropdowns for more detailed analysis. So you can quickly navigate the app and get more targeted reports on your business.
- Custom Reports
One of Reportgenix’s most attractive features is the custom report. You can generate data, count orders, and create custom reports with a click. Select the category, and the app will bring you all the reports.
You can also have a breakdown of sales, visitors, marketing, orders, and profit in the form of graphs, tables, and pie charts. This will help you compare your monthly performance and see the growth of your business.

- AI Integration
Custom reports are not enough? Ask for any data or reports of your store with GenixAI.
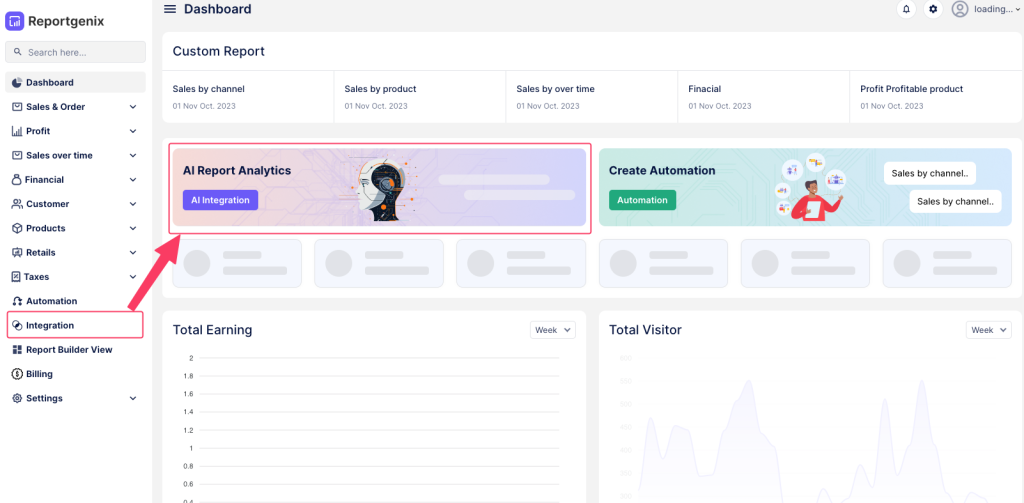
This AI integration acts like a Ginnie, to whom you can ask anything related to your store’s performance, and it will bring you results. Thus, Reportgenix literally gives you a personal analyst who knows everything in and out of your store!
- Automated Report Scheduling
Even if you don’t take the initiative to go through regular performance checking, Reportgenix is there to report you!
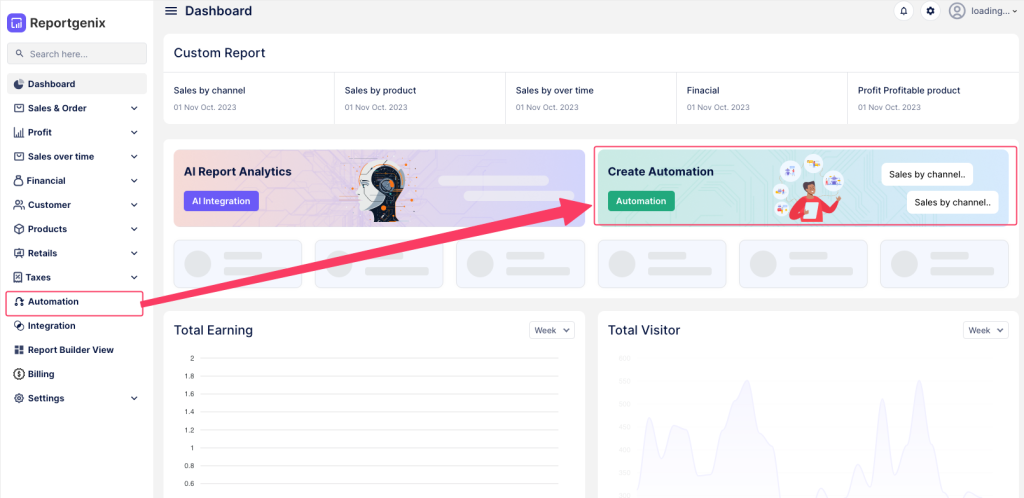
The automated scheduling feature allows you to set daily, weekly, or monthly report generation and delivery. So you are always aware of what’s happening in your store. This app will send the report directly to your inbox, which you can share with your team members.
- Advanced Filtering and Segmentation
Want to gain deeper insights into your store’s performance? Reportgenix’s advanced filtering and segmentation features will take you to the root level of your analysis. You can sort the data by date, product type, currency, location, etc.
Reportgenix even filters the performance of your gift card campaign, return orders, and fulfillment. You can track active gift cards, recently fulfilled/canceled orders, return rates, and a lot more.
- Mobile Accessibility
Reportgenix has a responsive design. You need not open your laptop every time to check out your store’s performance.
You can track your store’s performance from your smartphones or tablets and get real-time access at any time from anywhere. This go-to mobile-optimized interface gives you a seamless experience.
- Easy Data Export
Reportgenix allows you to export the report in various formats, such as CSV, Excel. With a click, you can share the analytics with your team in your own convenient way.
Besides, it seamlessly integrates with other tools and platforms, like Google Analytics.
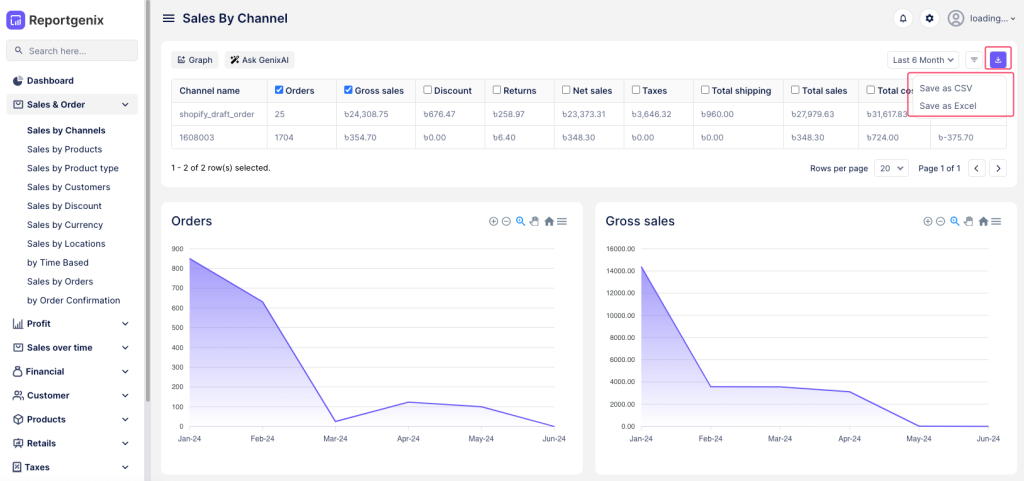
E-Commerce Store Performance With Reportgenix – A Complete Guide
You can easily navigate its functions once you install Repotgenix in your Shopify store. Thanks to its crystal clear dashboard that offers quick access to all the features.
You can analyze your store performance in multiple dimensions. Here is a basic guide to help you out with using Reportgenix for e-commerce store performance analysis-
- Get Your Personal Analyst With GenixAI
The integration of GenixAI will take your custom reporting experience to the next level!
To access the AI integration, navigate to the dashboard and click the ‘Ask GenixAI’ button.

This will take you to the interface, where you can ask any questions about your store’s performance.
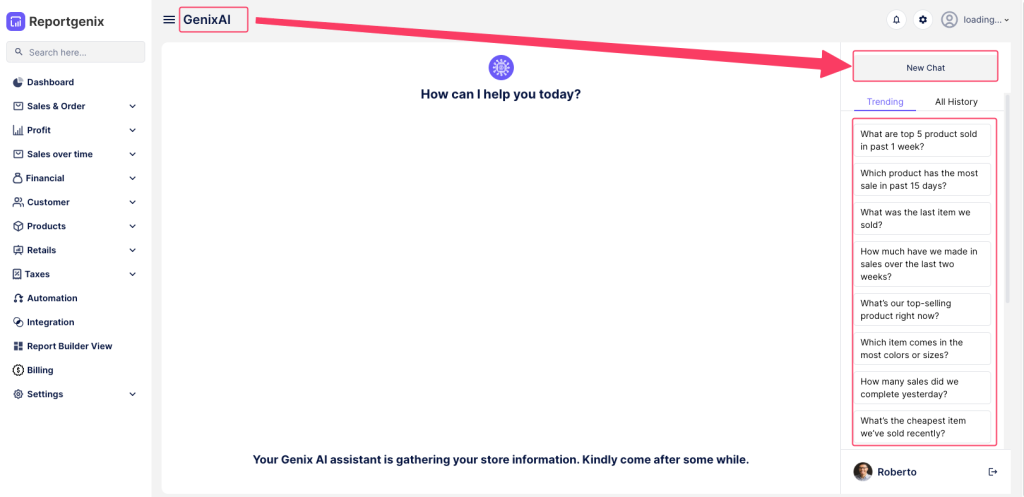
Select the ‘New Chat’ button on the right-hand side of the screen to ask your questions. Here, you can search for anything; top sales, least selling items, or whatever you want.
You can also look at the history to check past reports or go through the trending surveys. However, gathering the data and presenting the report will take some seconds.
- Analyze Your Sales Performance In Categories
Sales performance is the major interest in analyzing your business. To make it more effective, Reportgenix categorizes sales performance in different dimensions.
Click on the dashboard’s ‘Sales & Order’ dropdown to open all the sales categories for analysis. This includes-
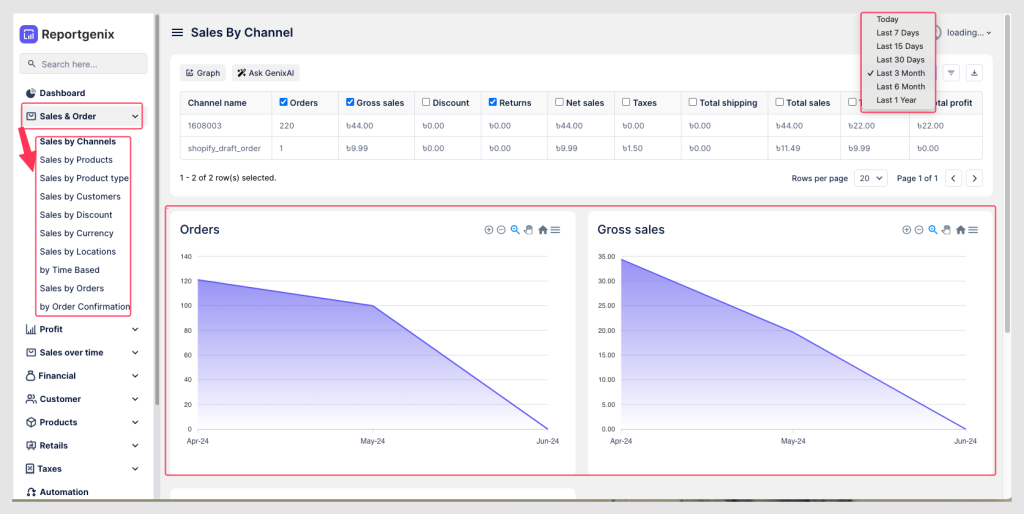
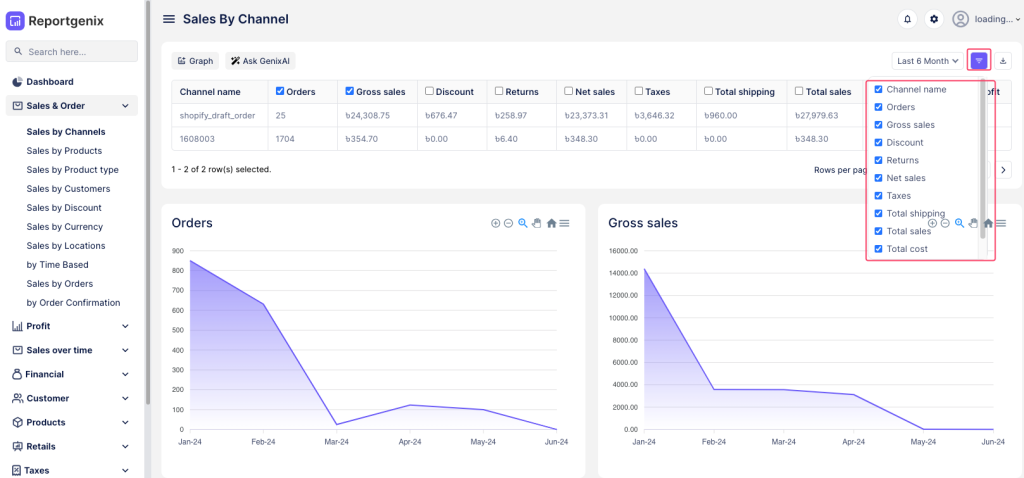
You will get an in-depth report for each of these categories. Right at the top, there are filter options and graph for more targeted analysis. For instance, the analysis can include gross sales, discounts, returns, taxes, or other considerations. Scrolling down will bring you a report for all these criteria.
You can click on the day-indicating dropdown bar to select the day range for the report. It will provide you with a report covering the present days up to a year. Thus, you can track yearly sales performance on a single platform.
- Find Out Profit From Individual Sales Category
Reportgenix allows you to track the profit of individual categories for better analysis. You can get the review of profit as-
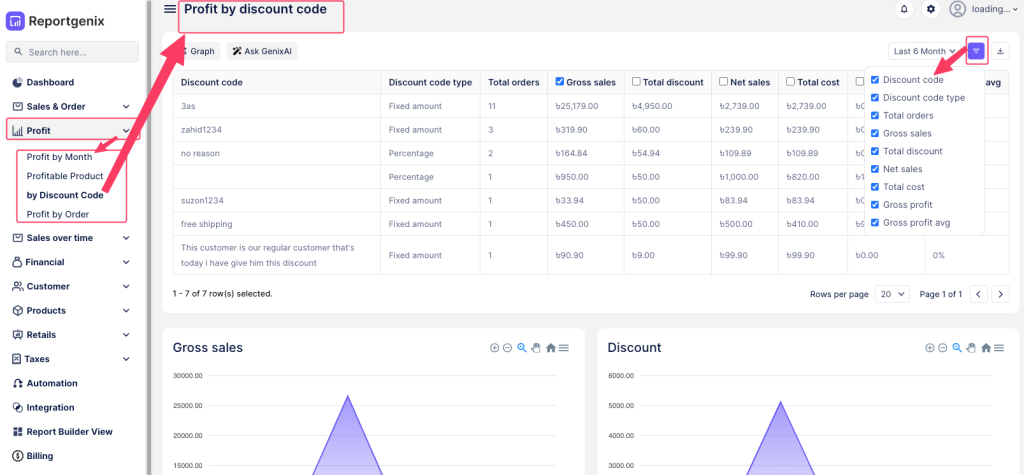
This event tracks the profit by filtering product name/category, order ID, date, gross sale, etc. Thus, you get a clear report of your daily, weekly, monthly, and yearly profit in seconds. More impressively, you can download the reports in SVG, PNG, and CSV format with a click.
- Make Report Analysis Much Easier With Graphs & Chart
Want to quickly check your store’s performance? Get rid of boring data and explore graphs.
You will find a graph option throughout the app that provides an easy performance overview. It gives you three different styles to choose your graph reporting style. You can select the one which you find more convenient.

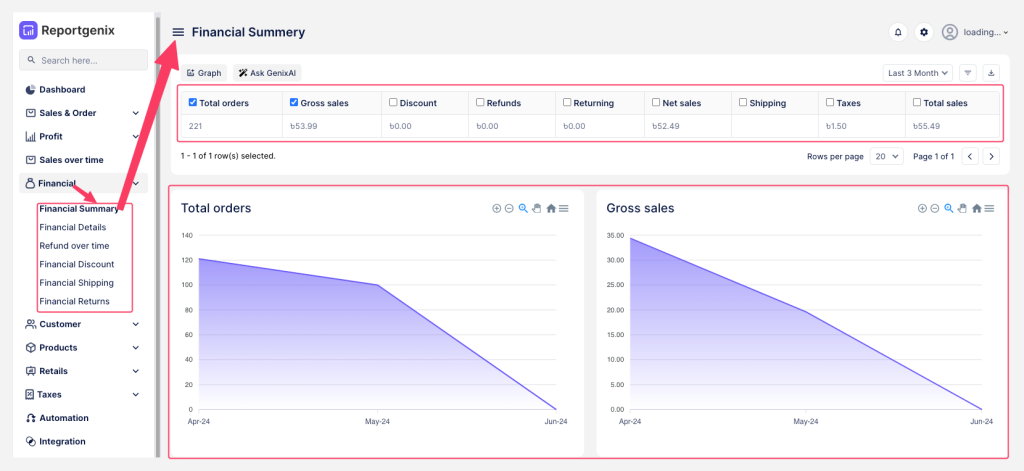
- Track Your Finances
Reportgenix is your ultimate financial manager, bringing you all your business’s financial statuses.
Along with a financial summary, it gives you deep analytics on financial details, discounts, shipping, returns, and refunds over time. Thus, you can track your earnings, spending, investments, and returns at once.
- Analyze Customer Behavior
You will get all the customer info, shopping behavior, and responses to your marketing strategy with Reportgenix. Select the ‘Customer’ dropdown button, and you will get options for analyzing-
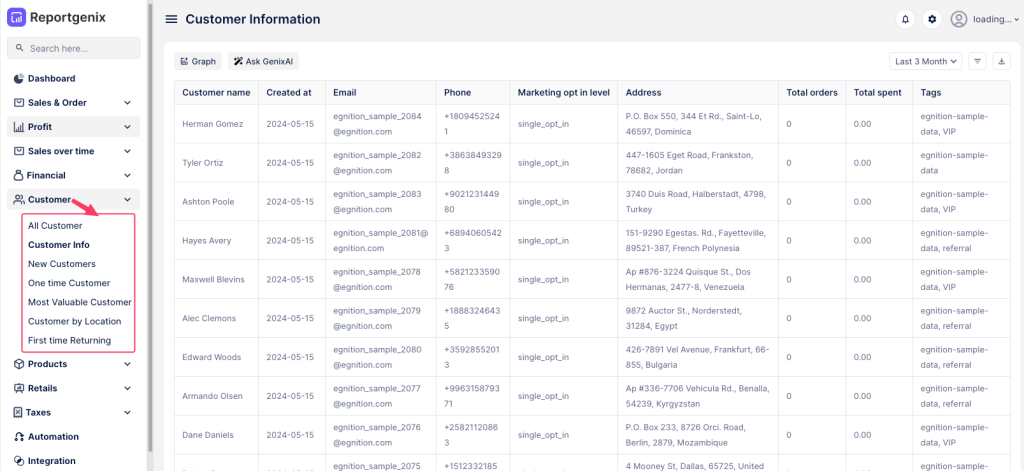
Here, you will get individual customers’ phone numbers, addresses, total orders, total spending, and all the details. Thus, it helps you track the loyal customer. You can run special campaigns for these customers and offer special discounts.
Nevertheless, customer behavior will also guide you in tracking the effectiveness of your marketing strategy.
- Integrate With Third-Party Apps For Extensive Analysis
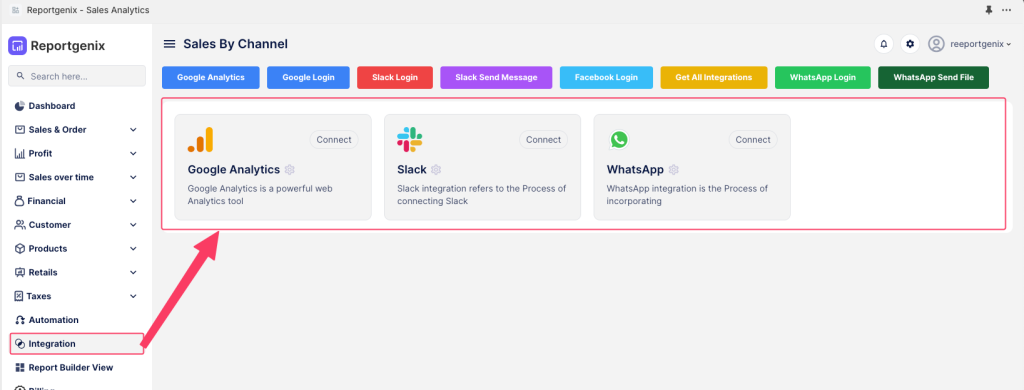
Third-party app integration facilities gather all your favorite tools together! You can seamlessly integrate Reportgenix with Google Analytics, Slack, WhatsApp. This allows for a comprehensive view of your business metrics across different systems.
All you need to do is scroll down the dashboard slides and select the ‘Integration’ button. Here, you will find all available integration options. Press’ connect,’ and Reportgenix will get integrated with the selected tool or app. Now, you can check the Google Analytics results or your Facebook sales performance directly from Repotgenix.
Tips For Successful E-Commerce Store Analysis
Now that you know how to use the Reportgenmix app, here are some tips to make your analytics more effective-
- Use Key Performance Indicators (KPIs)
KPIs are the measurable factors that show your store’s progress towards your goals. You must pick the right KPIs for performance analysis to ensure your business objectives are fulfilled.
Common KPIs for e-commerce stores include-
- Conversion rate
- Average order value
- Profit
- Customer lifetime value
- Customer acquisition cost
Focus on these factors to track your business’s real picture and tackle action accordingly.
- Segment Your Data
Never rely on an overall performance overview. Instead, segment your products, orders, customers, fulfilments, etc.
This will give you a more targeted report of your store’s performance. For best results, explore all the features of Reportgenix to get an in-depth analysis.
- Implement Robust Tracking Tools
Use an efficient tracking tool to conduct a deep investigation of your store. In this case, nothing works better than Repotgenix.
Besides going through the app’s analytics, you should also go through Google Analytics and other popular tools. You can integrate these tools with Reportgenix and use them from a single dashboard.
- Conduct A/B Testing
A/B testing will help you to improve your store functionality and increase sales. Experiment with different versions of your website or store and check user experience.
You should also implement new marketing strategies and track how they go about using analytical apps. This way, you can identify the fruitfulness of your strategy and utilize analytical apps in the best way possible.
- Real-Time Data Analysis
Select apps that offer real-time data analysis, like Reportgenix. You must set up a daily report notification system. Thus, the app will email you a live update on your store. So you can track your business performance anytime.
- Track and Optimize Marketing Campaigns
Use UTM parameters and tracking tools to measure the effectiveness of your marketing campaigns. Monitoring the ad’s performance is also essential.
You will get all these features in Repotgenix! Optimize your campaign using data from different channels to maximize your ROI.
- Train Your Team
Without proper analysis of your e-commerce store performance, you won’t be able to track your progress efficiently. So, train your team and empower them to make data-driven decisions that can improve the store’s performance.
Common Challenges Around E-Commerce Analytics
You may face some issues while conducting a performance analysis of your e-commerce. These are as follows-
- Challenges in Unifying Data from Multiple Sources
During data analysis, you need to gather data from different channels, such as Facebook Ads, Google Ads, etc. The formatting and analytical standards of all these channels are not the same. Eventually, it becomes a massacre to sort it all on a single page.
However, no more worries with Repotgenx. This app will route all your data into one platform. You can integrate third-party apps like Facebook Pixels, Google Analytics, Whatsapp, and more into your dashboard. So, you need not move back and forth for deep analysis.
- Privacy Issues
The app you use for performance analysis of e-commerce stores deals with customer information. This includes- address, phone number, account number, and other personal data. Failure to secure this information can lead to legal consequences. This is why it is essential to use a secure app for performance analysis.
Reportgenix adheres to data privacy laws such as GDPR and CCPA. So, your customers’ privacy will always remain secure using this app.
- Data Overloading
E-commerce platforms often collect vast amounts of data, which can lead to data overloading. This makes it difficult to identify useful insights and trends. Besides, it also ends up with loading issues. Such problems eventually lead to bad user experience and kill time.
Nevertheless, with Repotgenix’s fast-loading feature, you won’t have such problems. It takes a maximum of 10 to 15 seconds to scan all the data and present you with the overall performance of your store.
This app can also store all data from the last year, irrespective of the amount of data—therefore, there are no overloading issues.
- Data Inconsistency
Irrelevant and unreliable data is a major issue in performance analysis. This mainly occurs due to errors in data entry and differences in tracking standards.
However, Reportgenix eradicates such data inconsistency. It collects data directly from your Shopify store and shows results based on this. You can then directly copy these data as CSV, Excel, and PDF in a click. So, no manual hassle means no chance of error.
- Cherry-Picking Data
In e-commerce analytics, it’s important to look at all relevant data for a true picture of your store’s performance. However, cherry-picking data never brings up the actual scenario of your business performance. It will only select information supporting a certain view and ignore data contradicting it.
Reportgenix offers you a filtering option for more targeted analysis. You can choose specific criteria to add to the report. Thus, it will provide you with a performance analysis from all possible dimensions you want.
For instance, this app will offer you filters to choose from while analyzing the sales performance. This includes- net sales, gross sales, discounts, taxes, etc. You can tick-mark the criteria that are logical and relevant to your report. This way, you can avoid irrelevant cherry-picking and examine your store’s performance from multiple perspectives.
Wrapping Up: Reportgenix- The Ultimate Analytic Solution!
If you are looking for a complete reporting and analytical solution for your e-commerce store, Reportgenix is the best choice. It will not only save you time tracking performance but also ensure accuracy and data privacy.
Above all, you will get real-time analytics with this app. The categorization and filtering feature of Reportgenix further allows you to measure the store performance from multiple dimensions. Thus, you can address sales, taxes, fulfillments, profits, returns, marketing, finances, transactions, third-party integrations – all in a single platform!
How often should I conduct performance analysis for my e-commerce store?
For the best results, you should conduct a daily performance analysis of your e-commerce store. A report analytical app with automated scheduling features will keep you updated with daily performance.
What are the most common types of data in marketing analytics?
The most common data types in marketing analytics are traffic source, profit, conversion rate, geographical location, etc.
What are the benefits of e-commerce analytics?
E-commerce analytics helps you identify your store’s progress and drawbacks. Thus, you can take effective measures to improve store performance.
How do marketers use analytics to make decisions?
The markets check the effectiveness of their marketing campaigns through analytics. This way, they can identify what strategy works best to boost sales and conversation rates, which helps them make the right decision.
Which E-commerce stores does Reportgenix support?
Reportgenix is built for Shopify users.
Can I integrate Reportgenix into Google Analytics?
Reportgenix integrates with several third-party tools, including Google Analytics. Thus, you can access all your favorite apps and tools from the same dashboard.
