How to Create Shopify Custom Reports from Apps
Get Summary On:

Data analytics is the secret weapon for Shopify merchants aiming to optimize their store performance. From tracking sales trends to understanding customer behavior, effective data management provides insights. It ultimately drives growth and efficiency.
However, Shopify’s custom reports limitation hampers store owners data analyze. Therefore, they can’t act on time on their data.
This is where custom Shopify reports come into play. By using advanced reporting tools and apps, merchants swiftly create tailored reports that provide deeper insights, and tasks integrate seamlessly with their workflow.
In this blog, we’ll walk you through the benefits, tools, and techniques to unlock the full potential of your store data.
What Are Shopify Custom Reports?
Shopify custom reports are fully customizable analytics tools that allow merchants to define what metrics and fields are important to their store, unlike default reports, which provide pre-set metrics to meet specific business goals.
Custom reports empower merchants to tailor their data analysis to unique business needs and objectives. These reports can provide deeper insights into customer behavior, sales trends, and inventory performance by allowing users to select specific metrics, dimensions, and time frames.
Merchants can focus on metrics such as conversion rates, average order values, or customer retention rates, ensuring they analyze the most relevant data for their particular strategy.
Key Benefits of Custom Shopify Reports:
- Tailored Metrics:
Track the data that matters most to your business, whether it’s sales performance, inventory turnover, or customer lifetime value. By customizing your metrics, you can gain deeper insights into your operations and make informed decisions that drive growth.
Utilize dashboards that allow you to visualize these key performance indicators (KPIs) in real-time, enabling you to identify trends and anomalies quickly.
Implementing automated reporting can further streamline your processes, giving you more time to focus on strategy and development.
- Enhanced Decision-Making:
Use detailed insights to make informed decisions that improve store operations and profitability. By leveraging real-time data analytics, managers can identify trends in customer behavior, optimize inventory levels, and streamline staffing needs.
For instance, analyzing sales patterns can reveal peak shopping times, allowing for better scheduling of employees to enhance customer service during busy hours.
Additionally, understanding which products are frequently purchased together can inform promotional strategies and product placement, driving higher sales volumes.
- Customization Options:
Add fields like custom tags, filters, and templates to analyze unique data points. This flexibility allows users to tailor their data management experience, ensuring that they can capture and interpret information that is most relevant to their specific needs.
- Scalability:
Adapt your reports as your store grows or as new trends emerge. As your business expands, it’s crucial to ensure that your reporting processes can evolve alongside it.
This means implementing flexible reporting tools that can accommodate increased data volumes, new product lines, or changing customer demographics.
Regularly review your key performance indicators (KPIs) to make sure they remain relevant and reflective of your current goals.
Leveraging cloud-based analytics solutions can also enhance your ability to scale, providing real-time insights that help you make informed decisions quickly.
These reports are especially valuable for store owners who need detailed insights into specific aspects of their business, such as inventory management, customer segmentation, or financial analysis.

Why Use Shopify Apps for Custom Reports?
The native reporting tools are functional but often lack the depth and customization required for more complex analytics. This is where apps like Better Reports, Report Pundit, and Reportgenix excel.
Limitations of Default Shopify Reports:
- Restricted metrics that may not cover your business needs.
- Limited options for customizing fields and templates.
- Lack of automation features for recurring reports.
Advantages of Reporting Apps:
- Automation: Schedule recurring reports and receive them directly in your inbox.
- Custom Dashboards: Create personalized dashboards to track sales, inventory, and customer data in real-time.
- Integration Capabilities: Sync your store data with other tools like Google Sheets or analytics apps.
- Data Export Options: Export reports in formats like Excel, CSV, or PDF for external analysis.
Example Use Case:
Imagine a store owner who needs to track seasonal sales trends across multiple regions. By using a reporting app, they can create a report that filters sales by product type, region, and time period.
These insights allow them to adjust inventory and marketing strategies effectively.

Top Features of Custom Reporting Apps
Shopify reporting apps offer features that transform how merchants interact with their data. Below are some standout features:
- Automation of Reports– Automated reports save time by generating and delivering insights without manual input. For instance, you can set up daily sales summaries or weekly inventory updates. This saves time and ensures that stakeholders receive timely insights without manual intervention.
- Advanced Visualizations– Custom reporting apps include dashboards and charts that make it easier to identify trends at a glance. These visuals are especially helpful for tracking performance metrics over time.
- Export and Sharing Options– Export reports in formats like Excel or PDF to share with team members or stakeholders. Some apps also allow reports to be shared via email automatically.
- Inventory Tracking– Monitor stock levels, identify best-selling products, and prevent stockouts or overstocking.
- Customer Behavior Analysis– Dive deep into customer data to analyze purchase patterns, average order value, and customer retention rates.
Step-by-Step Guide to Creating Custom Reports
Step 1: Define Your Goals
Identify what you want to achieve with your reports. For example, do you want to improve sales, and inventory management, track marketing ROI, or analyze customer demographics?
Step 2: Choose the Right App
Select a reporting app that aligns with your needs. Popular options include:
- Better Reports for comprehensive analytics and customization.
- Report Pundit for user-friendly templates and quick insights.
- Reportgenix for scalability and advanced features.
Step 3: Gather Data Sources
Integrate data from your store, third-party apps, and external sources like Google Sheets to ensure a holistic view.
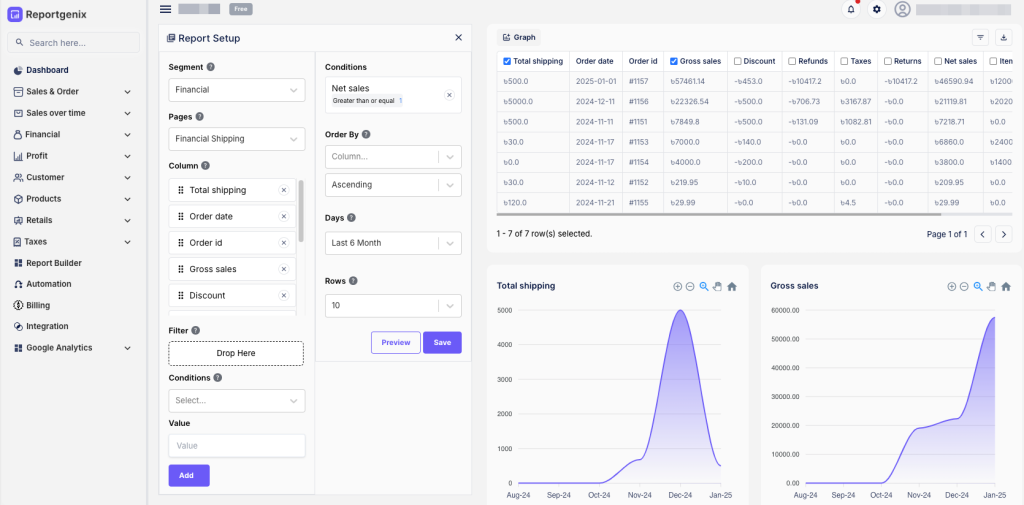
Step 4: Customize Your Report
Define specific metrics, filters, and fields. For instance, filter sales data by region or time period, or analyze inventory by supplier.
Step 5: Automate and Export Reports
Set up automation for recurring reports and export them in your preferred format for further analysis.
Best Shopify Apps for Custom Reports
Here’s an overview of top Shopify reporting apps:
- Better Reports
- Offers over 2000 data fields and extensive customization options.
- Supports advanced inventory tracking and financial reporting.
- Report Pundit
- Known for its user-friendly interface and pre-built templates.
- Provides options for automating and exporting reports.
- Reportgenix
- Ideal for merchants who need advanced AI enhanced analytics, detailed customer segments and robust customer support.
Improving Decision-Making with Custom Reports
Custom reports empower store owners to make informed decisions that drive growth.
Optimize Inventory Management: Prevent stockouts by monitoring inventory trends.
Track Marketing ROI: Measure campaign performance using sales data and customer acquisition costs.
Enhance Customer Experience: Use customer behavior data to personalize offers and improve satisfaction.
For example, if your store data shows a surge in demand for certain products during holidays, you can adjust inventory and marketing strategies to capitalize on these trends.
Advanced Shopify Reporting Techniques
- Cross-Channel Integration:
Combine data with other sales channels to gain a unified view.
- Predictive Analytics:
Use data trends to forecast sales and optimize operations proactively.
- Customer Segmentation:
Identify high-value customers and target them with tailored marketing campaigns.
Stay ahead for Shopify success with custom reports
Custom Shopify reports are essential for merchants who want to unlock the full potential of their store data. With the right reporting app, you can gain actionable insights, automate repetitive tasks, and make data-driven decisions to grow your business.
Shopify custom reports assists you segment your customers based on their purchasing habits, location, and demographics.
Understanding your customer segments allows you to tailor your marketing campaigns and improve customer engagement, ultimately enhancing customer loyalty and increasing sales. Automation is another significant benefit of using a reporting app.
By automating the generation and distribution of reports, you can save time and reduce the risk of human error.
This allows you to focus on strategic initiatives rather than getting bogged down in manual data analysis.
FAQs About Shopify Custom Reports
What are custom Shopify reports?
Custom Shopify reports are tailored analytics tools that allow you to define metrics, fields, and templates specific to your store’s needs.
How can I automate Shopify reports?
Most Shopify reporting apps include automation features that let you schedule recurring reports to be delivered via email or exported to other tools.
What are the best apps for Shopify custom reports?
Popular options include Report Pundit, and Reportgenix, each offering unique features and customization options.
How do custom reports improve store performance?
They help you track key performance indicators like sales, inventory levels, and customer behavior, enabling you to make informed decisions.
Can I export Shopify reports to Excel or Google Sheets?
Yes, most reporting apps allow data export in formats like Excel, CSV, and Google Sheets for further analysis.
Are free trials available for reporting apps?
Yes, many apps, including ReportGenix, and Report Pundit, offer 14-day free trials to explore their features.


