Shopify Stores globally trust us


Key features
Essential features to make Shopify reporting effortless.
Your AI helper for Shopify reports.
AI-powered reports for faster, easier reports. Just ask a question and get a clear report.
- Premade prompts for quick answers
- Use custom prompts for your reporting needs
- Faster answers without manual filters or setup


Connect with your favorite tools
AI-powered reports for faster, easier reports. Just ask a question and get a clear report.

Automation that saves you time
Schedule reports, set up recurring insights, and let Reportgenix handle the heavy lifting while you focus on growth.

Custom reports in a few clicks
Build the exact Shopify reports you need, just drag, drop, and filter without technical skills.
- Save custom reports for quick access anytime.
- Add filters, dimensions, and measures with just a click.
- Choose from premade templates or start from scratch.

We help this business
Ultimate solutions for your Shopify business needs.
Optimize sales insights
Grow sales up to 2× faster with focused insights.

Maximize profit margins
Recover up to 15% more profit by
reducing waste.

Simplify reporting
Save 10+ hours every week, no spreadsheets required.

Improve customer retention
Keep customers coming back and lift LTV by 30%.

Stay on top of inventory
Cut stockouts by 40% and keep orders flowing smoothly.

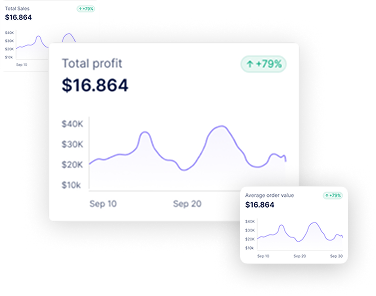
Profit Overview
Track your profits that actually makes sense
Essential features to make Shopify reporting effortless.
See exactly how much you're earning
Get real-time revenue insights track trends, and optimize strategies with Shopify.Spot your bestsellers instantly
Instantly see what sells best and what doesn't, so you can stock what actually profits.
Make decisions that with clear number
Know exactly what to push, pause, or drop to see exactly what moves the needle for your profits.

Sales Analytics
Turn your sales data into actionable insights
Essential features to make Shopify reporting effortless.
Identify top-performing products
Analyze product performance to understand which items generate the highest revenue.Optimize your sales strategy
Use data-backed insights to refine pricing, forecast demand and improve overall sales efficiency.
Make smarter sales decisions
See a clear insights to restock smarter, and grow your shopify store faster.

Customer analytics
Identify your most valuable Customers
Essential features to make Shopify reporting effortless.
Measure customer lifetime value
Gain a complete view of purchase frequency, retention, and total spend for all segments.Discover buying behavior patterns
Analyze how customers interact with your store to predict churn and improve engagement strategies.Grow with retention & loyalty
Use clear view to reward loyal buyers, add offers, and keep your best customers coming back.
Get Report
Tailored solutions for your business needs