POST BY
The Ultimate Guide to Shopify Analytics App: Boost Your Store’s Performance in 2025
June 29, 2025
12 Min Read
Get Summary On:


Running a successful Shopify store requires more than just great products and attractive design. To truly thrive in today’s competitive e-commerce landscape, you need deep insights into your store’s performance, customer behavior, and sales trends. Choosing the right Shopify analytics app can make or break your growth strategy in 2025.
Shopify Analytics gives you access to visitor behavior, conversion rates, and sales trends. Whether you’re trying to grow traffic, boost conversions, or improve product performance, the insights you gain from these analytics can be a game-changer.
Whether you are just starting or looking to enhance your existing Shopify admin tools, this complete guide to Shopify analytics will help you use Shopify effectively to grow your business.
What is the Shopify Analytics App?
A Shopify analytics app is a specialized tool that integrates with your Shopify store to collect, process, and visualize your business data. Unlike Shopify’s basic built-in analytics, these dedicated applications offer advanced features such as customer lifetime value tracking, detailed conversion funnel analysis, and sophisticated reporting capabilities that help store owners make informed decisions about inventory, marketing, and customer experience optimization.

Why Does Your Shopify Store Need An Advanced Analytics App?
While Shopify provides basic analytics out of the box, these default reports often fall short of providing the comprehensive insights modern e-commerce businesses require, and the Shopify sales dashboard. According to recent studies, businesses that leverage advanced analytics are 5 times more likely to make faster decisions and 3 times more likely to execute decisions. If you’re looking to visualize your revenue, orders, and customer behavior in real-time, our Shopify Sales Analytics App breaks it down with smart dashboards that power better decisions.

A dedicated Shopify analytics app bridges this gap by offering:
Enhanced Customer Insights: Understanding customer behavior patterns, purchase frequency, and lifetime value helps you create targeted marketing campaigns that resonate with your audience.
Advanced Revenue Tracking: Beyond basic sales figures, these apps track metrics like average order value trends, seasonal patterns, and product performance correlations that inform strategic decisions.
Marketing Attribution: Proper attribution modeling helps you understand which marketing channels drive the most valuable customers, allowing for better budget allocation.
A Shopify Analytics App fills this gap by offering enhanced reporting capabilities, real-time data visualization, and actionable insights that can significantly impact your bottom line.
- Identify trends and patterns in traffic and sales
- Understand customer behavior and purchase paths
- Optimize marketing and advertising strategies
- Track KPIs like conversion rates, average order value, and return rates
Want to compare analytics tools head-to-head? Read our detailed comparison: ReportGenix vs Report Pundit

Key Features in a Shopify Analytics App
When selecting a Shopify analytics app, certain features distinguish exceptional tools from basic reporting solutions:
Real-Time Data Processing: The ability to access up-to-the-minute data ensures you can respond quickly to trends and opportunities. Look for apps that update metrics within minutes rather than hours.
Customizable Dashboard Creation: Your business has unique KPIs that matter most to your success. The best Shopify reporting tool allows you to create personalized dashboards that highlight your most important metrics.
Advanced Segmentation Capabilities: Customer segmentation based on behavior, purchase history, and demographics enables the development of personalized marketing strategies that significantly improve conversion rates. See how ReportGenix helps track revenue, orders, and customer behavior in real-time in our Shopify Sales Analytics App breakdown.
Cohort Analysis Tools: Understanding how customer behavior changes over time helps predict future revenue and identify potential churn risks before they impact your business.
Multi-Channel Attribution: Look for tools that can track customer journeys across multiple channels email, paid ads, social media, and organic search. Proper attribution ensures you’re investing in what actually works.
Integration with Marketing Platforms: Ensure the analytics app integrates seamlessly with tools like Facebook Ads, Google Ads, Klaviyo, and ReportGenix. This helps consolidate your data for a unified performance view.

Automated Report Delivery: Automated and scheduled reports and custom reports for Shopify delivery via email keep your team informed without manual effort. It’s essential for regular performance check-ins. Explore how ReportGenix Shopify automation reporting your analytics delivery with our Shopify Automate Report Analytics App.

Profit and ROI Tracking: Beyond traffic and sales, you should be able to track profit margins, customer acquisition cost (CAC), and return on investment (ROI) to make strategic business decisions.
User-Friendly Interface: Your analytics app should offer a clean, intuitive interface that makes data accessible to both technical and non-technical team members.
Alerts and Benchmarks: Some advanced tools offer smart alerts and benchmarks that notify you when metrics fall below expectations or outperform targets, keeping your business proactive.
Scalability: As your store grows, your analytics needs will too. Choose a platform that can scale with your operations, offering advanced features without a steep learning curve. Want to create custom metrics based on your unique business needs? Learn how our Shopify Reports Builder lets you drag, drop, and design your own reports in minutes.
Why Analytics Matter for Shopify Stores?
Shopify analytics reports transform raw data into actionable insights that directly impact your store’s performance. These reports typically include customer acquisition cost analysis, which helps you understand the true cost of gaining new customers across different channels. According to HubSpot, companies that track customer acquisition costs are 58% more likely to achieve their revenue goals.

Inventory optimization represents another crucial area where analytics reports prove invaluable. By analyzing sales velocity, seasonal trends, and product correlation data, you can reduce carrying costs while ensuring popular items remain in stock. This balance is critical, as stockouts can cost retailers up to 4% of their annual revenue.
Shopify Analytics Plans and Access Levels
Plan Comparisons
- Basic Shopify: Basic financial and traffic data
- Shopify Plan: Adds marketing and behavioral insights
- Advanced Shopify: Custom reports and filters
- Shopify Plus: Full access and integrations
Choosing the Right Plan
Upgrade your plan as your business scales to access more powerful insights.
Third-Party Analytics Tools Integration
Tools to Consider-
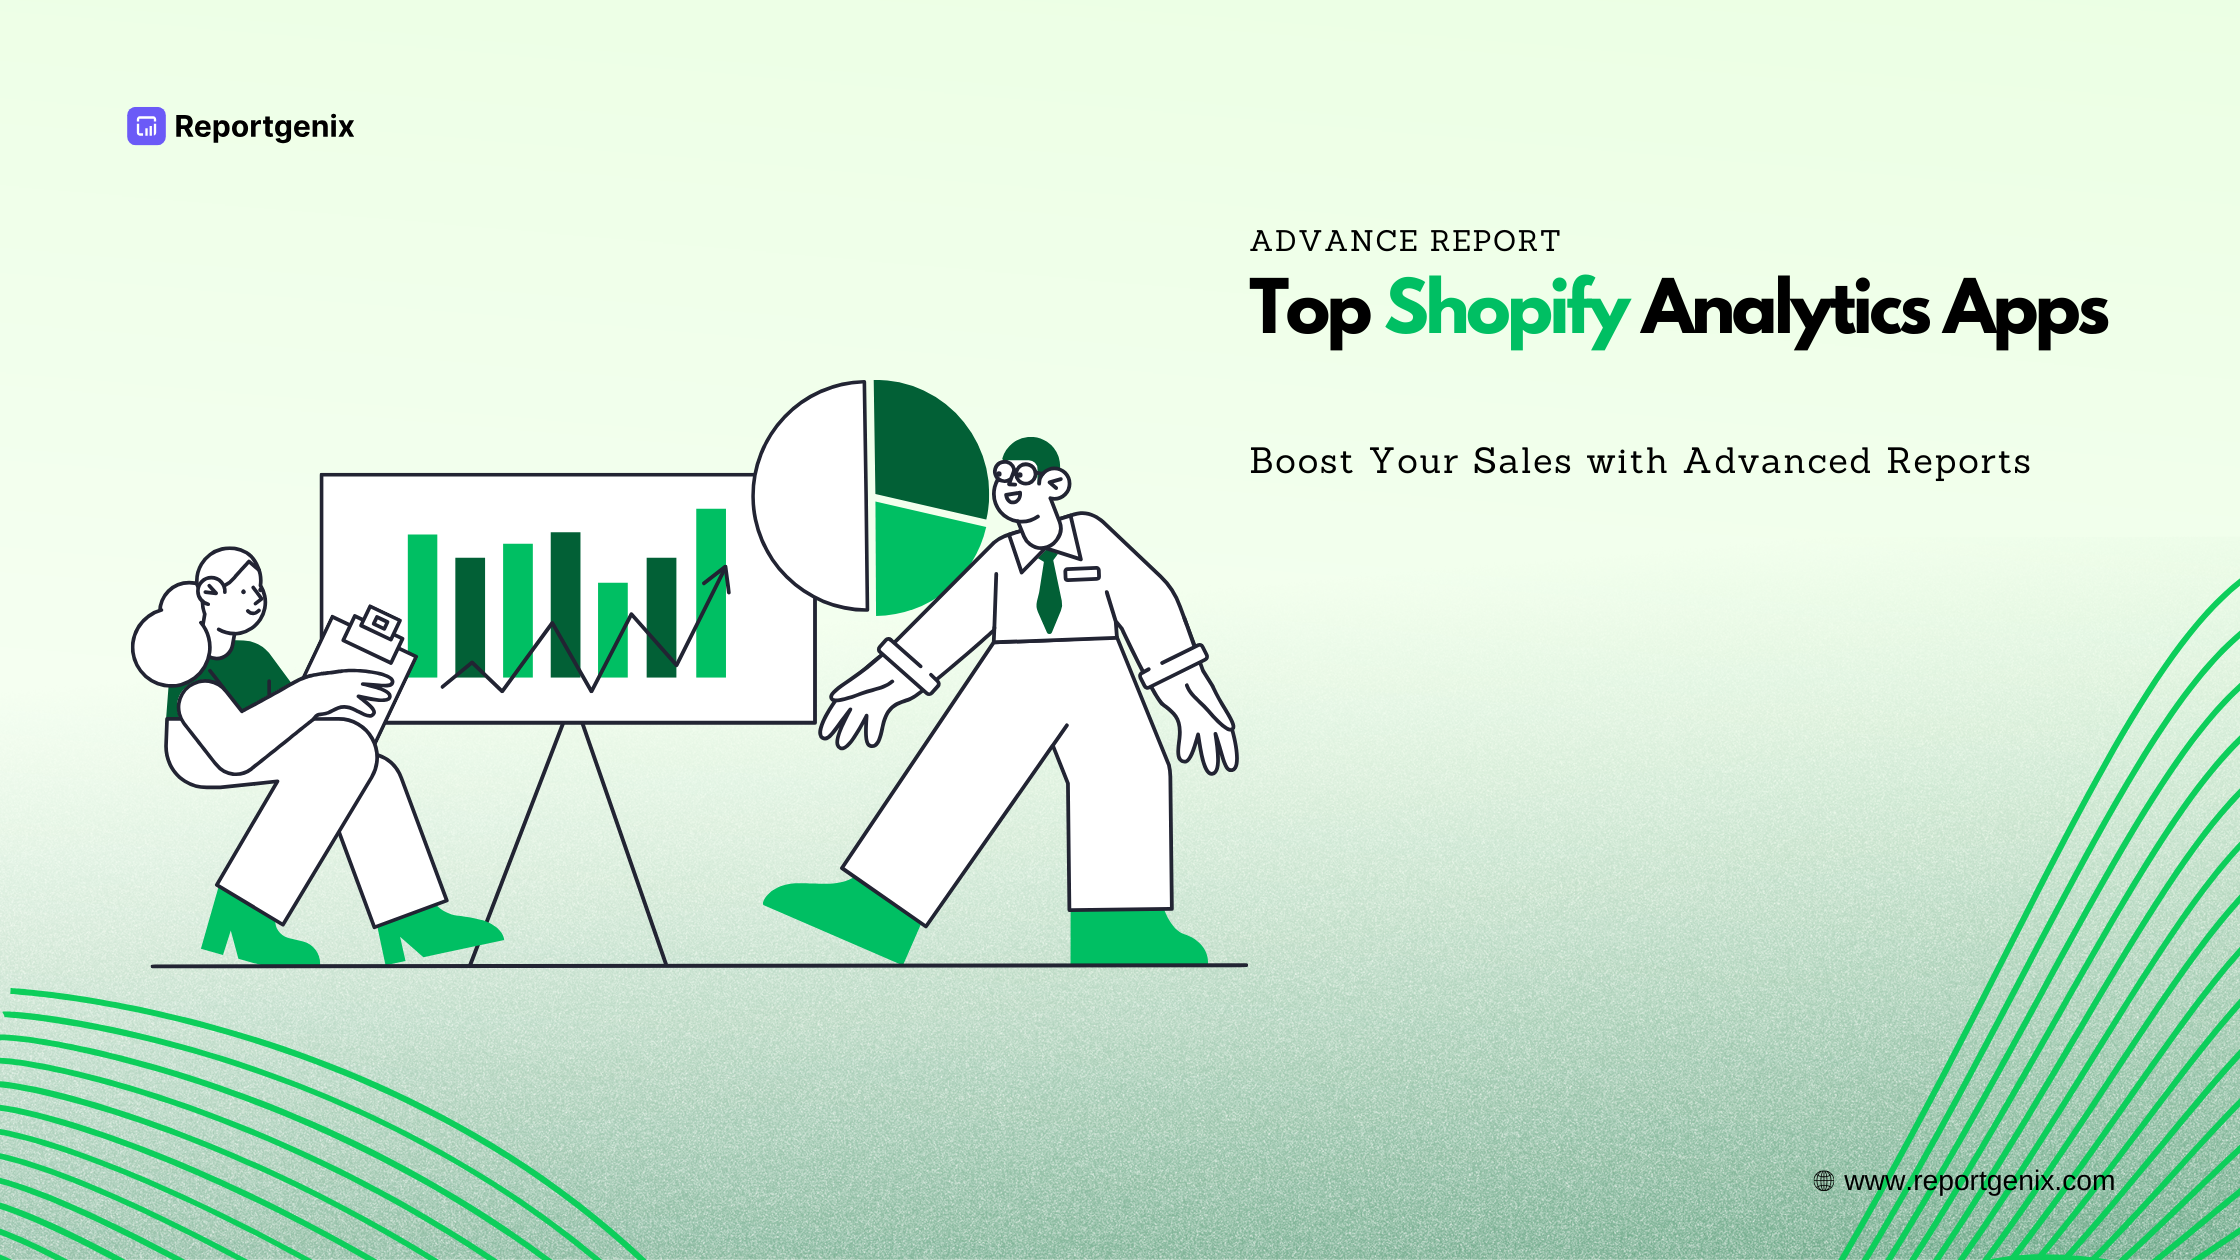
Top Shopify Analytics Apps: Boost Your Sales with Advanced Reports
- ReportGenix for dashboards
- Klaviyo for email
- Google Data Studio for blended insights
Benefits of Integration
Unify your data for better decision-making and automation.
When to Use External Tools
As your store scales, these tools provide the extra power needed to grow.
Best Practices for Using the Shopify Analytics App
Shopify Analytics can be incredibly powerful, but only if you use it the right way. Here are some easy-to-follow, real-world tips to help you get the most out of your data and make smarter business decisions.
1. Start with Clear Goals
Before diving into the numbers, ask yourself: what are you trying to achieve? Whether it’s boosting sales, increasing repeat purchases, or improving your conversion rate, having clear goals helps you focus on the right data instead of getting overwhelmed.
2. Make Reporting a Habit
Checking your analytics once a month isn’t enough. Set a regular rhythm like weekly or biweekly to review your key metrics. This way, you’ll spot trends early, see what’s working, and fix what’s not before it becomes a bigger issue.
3. Get Your Team Involved
Don’t keep the numbers to yourself. Make sure your marketing, sales, and support teams know how to read basic reports. When everyone understands the data, your whole business becomes more aligned and effective.
4. Slice and Dice Your Data
Not all customers are the same, so don’t treat your data like it is. Use segments like first-time vs. repeat buyers, mobile vs. desktop shoppers, or customers by region to uncover hidden insights that help you tailor your strategies.
5. Create Custom Reports
Shopify’s standard reports are helpful, but custom reports let you zoom in on exactly what matters to your business. Want to track sales by product bundle or see how a certain campaign performed by device type? Build a custom report and get answers faster. Learn how to build custom reports using our Shopify Reports Builder with drag-and-drop ease.
6. Track Progress Over Time
Don’t just look at yesterday’s numbers. Compare this week’s or month’s data to previous periods. This helps you understand whether your efforts are actually paying off and how fast you’re growing.
7. Share Insights Automatically
Use Shopify’s built-in scheduling or a tool like ReportGenix to automatically send important reports to your team. It keeps everyone on the same page and saves time.
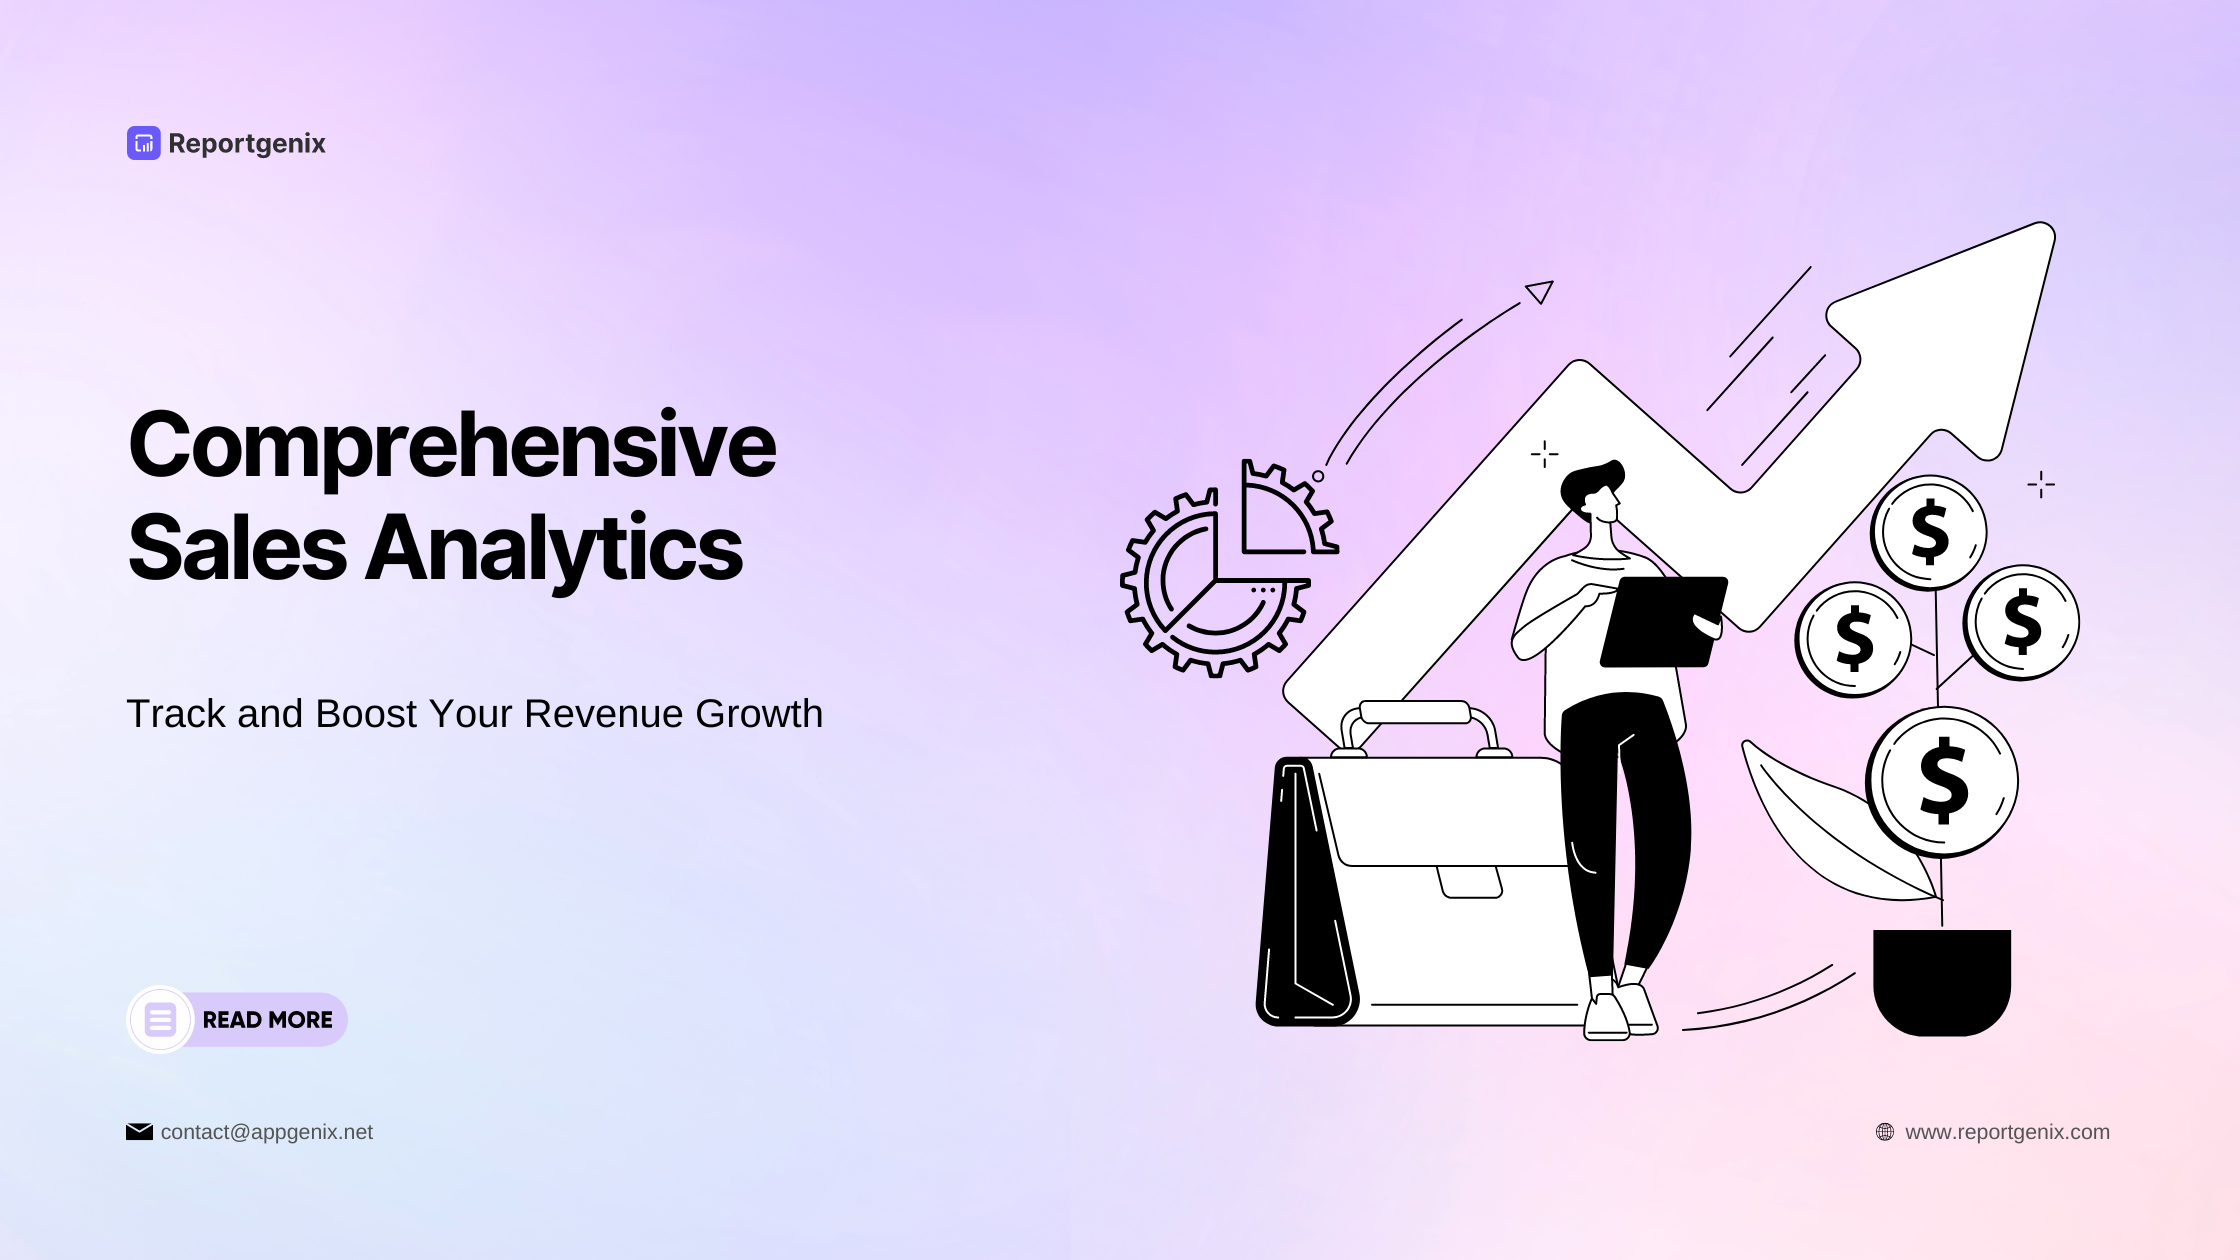
Maximizing Shopify Sales Analytics for Revenue Growth
Shopify sales analytics go beyond simple revenue tracking to provide insights that drive sustainable growth. Effective sales analytics help identify your highest-value customer segments, optimal pricing strategies, and seasonal opportunities that might otherwise go unnoticed.
Product performance analysis through sales analytics reveals which items drive the most profit, not just revenue. This distinction is crucial because high-revenue products with low margins might actually hurt your profitability. By focusing on profit-driven metrics, you can optimize your product mix and promotional strategies for maximum financial impact.
Geographic sales analysis helps identify expansion opportunities and regional preferences. Understanding where your customers are located and what they prefer enables targeted marketing campaigns and informed decisions about shipping strategies and local partnerships.
Common Pitfalls in Shopify Analytics App

Shopify Analytics gives you access to a ton of valuable data, but if you’re not careful, it’s easy to misread or misuse it. How to analyze Shopify sales, and here are some common mistakes store owners make and how you can avoid them.
1. Getting Distracted by Vanity Metrics
It’s fun to see numbers like page views or social likes go up, but those don’t always mean your business is growing. Focus on metrics that impact your bottom line, like conversion rate, revenue, and customer lifetime value.
2. Not Setting Up Proper Attribution
If you don’t tag your campaigns or track where your customers are coming from, you’ll never really know which marketing efforts are paying off. Always use UTM parameters and make sure your tracking tools (like GA4 or ReportGenix) are set up correctly.
3. Ignoring Mobile vs. Desktop Differences
Your store might look amazing on a laptop, but that doesn’t mean it works well on a phone. Always check your data by device type. You might find that mobile users are bouncing more or not converting as well, which is a big opportunity to improve.
4. Counting Your Own Visits
It sounds simple, but many store owners forget to filter out their traffic. That means your reports are full of “fake” sessions from you or your team. Set up IP exclusions to keep your data clean and accurate.
5. Looking at the Data… and Doing Nothing
Data is only useful if you take action. If you’re reviewing reports but not using those insights to make changes—like updating your homepage, tweaking ad targeting, or testing new offers you’re missing out.

Actionable Tips to Optimize Performance
- A/B test product page layouts
- Improve CTAs based on click data
- Adjust ad spend based on ROAS
- Increase AOV through strategic bundling
Conclusion
Shopify Analytics App isn’t just for big brands’ store performance; it’s for any business ready to grow with Shopify data. Successfully implementing a Shopify analytics app requires strategic planning and consistent execution. Start by defining Shopify merchant key performance indicators before installation, ensuring the Shopify app you choose can track and report on metrics that matter most to your business objectives.
Data accuracy depends on proper setup and configuration. Take time to configure tracking parameters correctly, including UTM parameters for marketing campaigns, customer reports, inventory reports, and proper product categorization for meaningful reports. An incorrect initial setup can lead to months of unreliable data that undermines decision-making confidence. Regular review and optimization of your Shopify data analytics setup ensures continued relevance as your business evolves. Schedule monthly reviews of your dashboards and reports to identify new opportunities and adjust tracking parameters as needed.
By understanding your store’s performance, you’ll make better decisions, optimize campaigns, and create a better experience for your customers.
Frequently Asked Questions
1. What’s the difference between Shopify’s built-in analytics and third-party analytics apps?
Shopify’s built-in analytics offer essential insights into sales, traffic, and basic customer behavior. They’re great for getting started. But if you’re looking for deeper data—like customer lifetime value (LTV), conversion funnel breakdowns, cohort analysis, or detailed segmentation—you’ll need a third-party analytics app. These tools fill in the gaps and help you make more strategic, data-driven decisions.
2. How much should I expect to pay for a quality Shopify analytics app?
Most quality analytics apps for Shopify range between $15 and $200+ per month. Pricing usually depends on your store’s size, order volume, and the features you need. Many apps offer flexible, tiered pricing, so you can scale up as your business grows.
3. Can I use multiple analytics apps simultaneously?
Yes, you can! A lot of growing stores use more than one app—for example, one for financial reporting, and a third for email performance. Just make sure your data is consistent across tools and avoid setting up duplicate tracking scripts that could slow down your site.
4. How long does it take to see meaningful insights after installing an analytics app?
You’ll start seeing basic data almost immediately. But for truly meaningful insights—like LTV, customer cohorts, and shopping patterns—you’ll need around 30 to 90 days of consistent data. Some metrics, like retention and lifetime value, often require 3–6 months to become useful.
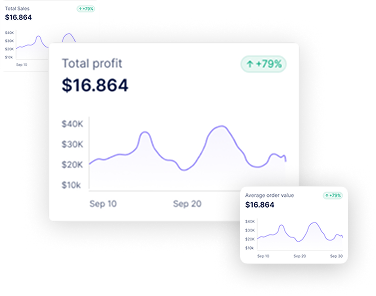
Analyze Your Shopify Store's True Profitability
Analyze Your Profits
Top Shopify Analytics Apps: Boost Your Sales with Advanced Reports Also Like
Analytics that make sense, profits that make a difference
Join 10,000+ merchants using smarter analytics.