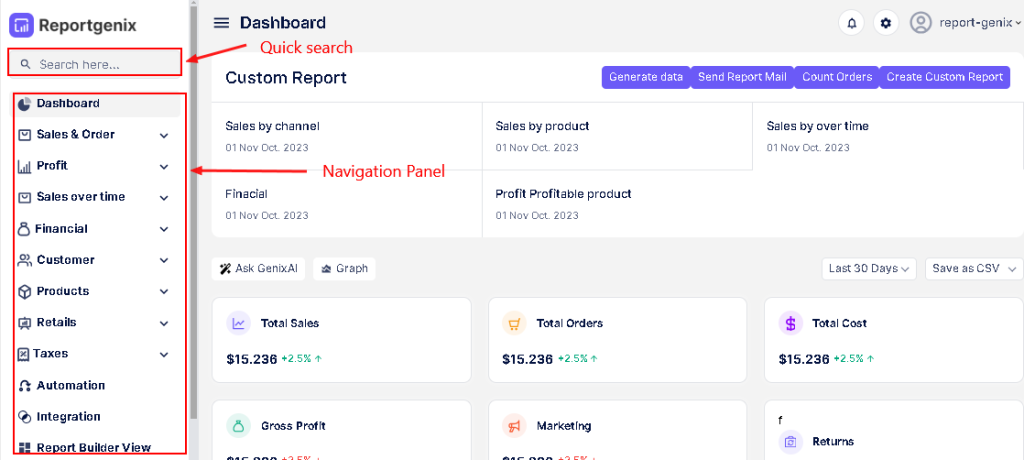
The navigation panel brings you all the segments of Reportgenix. It also has a search bar for quick access.
This page contains details on navigating the app.
Dashboard
Portrays a summary of important analytical fields. This includes-
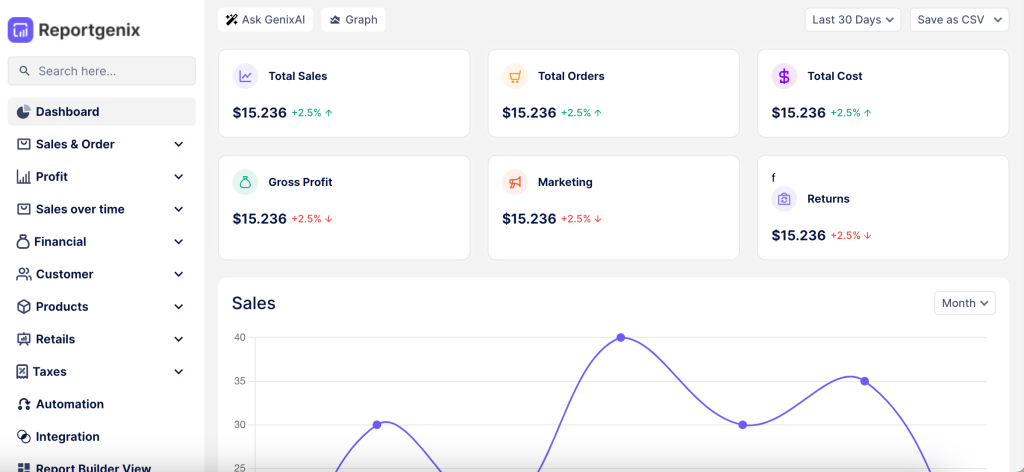
Dashboard
Portrays a summary of important analytical fields. This includes-
- Options to Generate Data, Send Report Mail, Count Orders, and Create Custom Reports.
- Time Range Selection- allows you to choose a time range for the report.
- Data Exporting options, selecting the format of saving data.
- Highlights of Total Sales, Total Orders, Total Cost, Gross Profit, Marketing, and Returns.
- Visual representation of Sales and Visitors with graphs.
- A breakdown of overall performance with pie diagram, it includes- marketing, returns, taxes, net profit, and more.
- Overview of orders shows total, daily average, and date-wise orders.
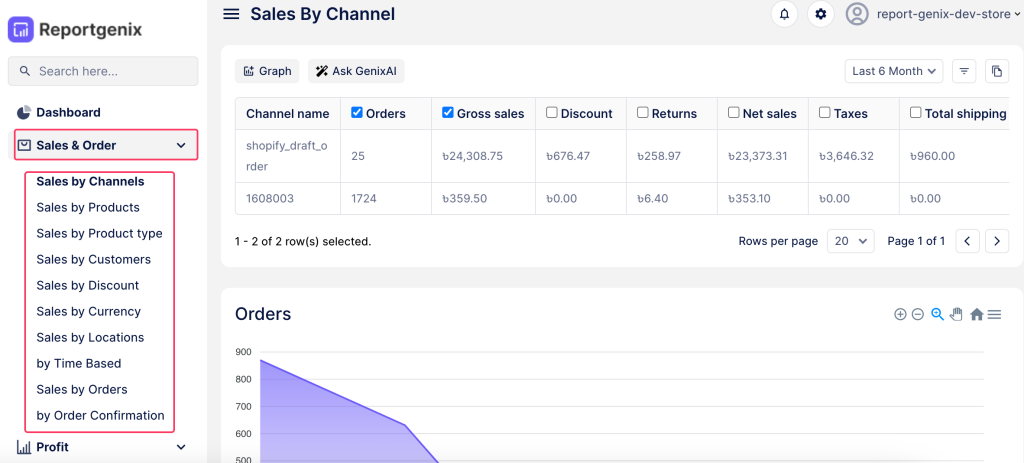
Sales & Order
It shows sales and order reports in 10 different categories. This includes Sales by Channels, Sales by Product Type, Sales by Discount, Sales by Customers, Sales by Currency, etc. It presents the report for each section with graphical visuals for a quick overview.
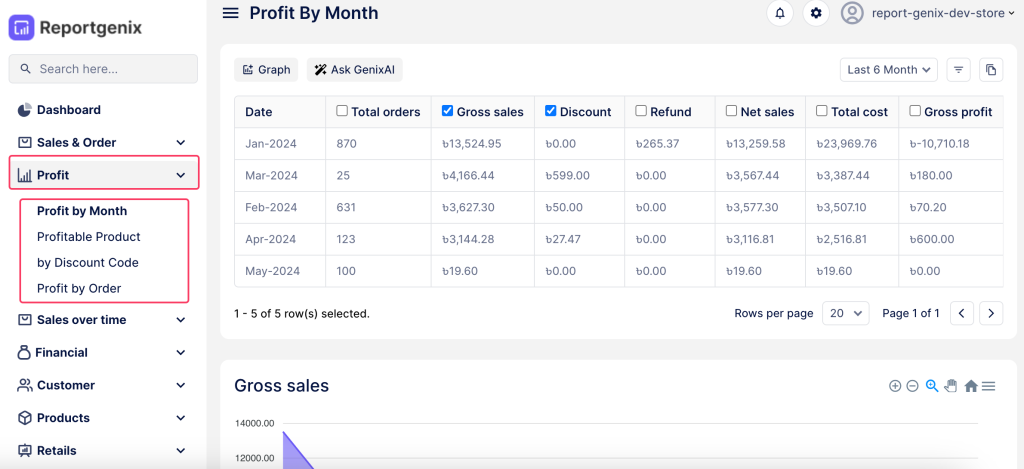
Profit
Gives you an outline of your daily, weekly, monthly or yearly profits. Profit reporting is divided into 4 categories- Profit by Month, Profitable Product, Profit by Discount Code, and Profit by Order. You will get a separate report for each of these categories.
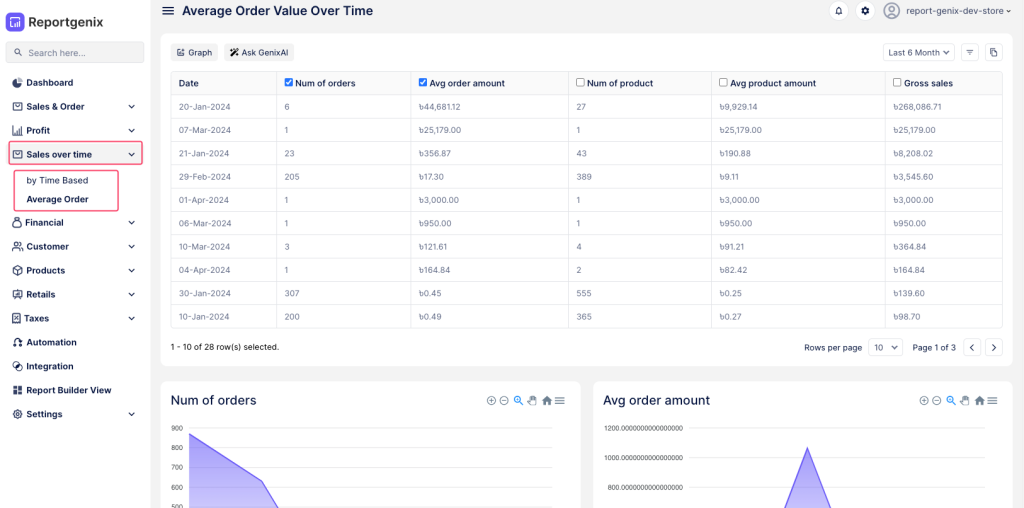
Sales over time
Brings you the sales report over time basis. You will get two segments in this field- by Time base and Average Order. The first option shows you the sales summary of the last 30 days, and the later gives an overview of average orders.
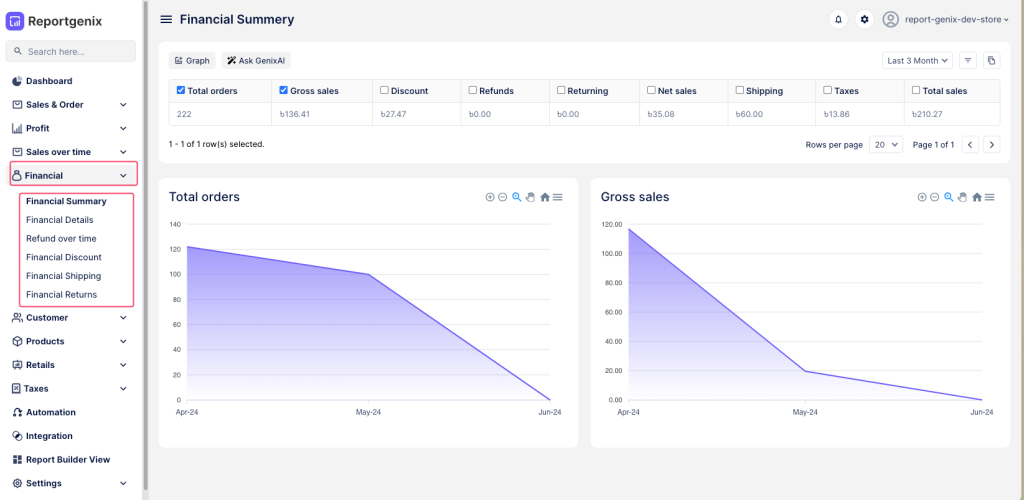
Financial
This section shows all details about finances. You can track your gross sales, net sale, refunds, returns, etc. It consists of 6 categories for more targeted reporting. This includes- Financial Summary, Financial Details, Refund over time, Financial Discount, Financial Shipping, and Financial Returns.
Customer
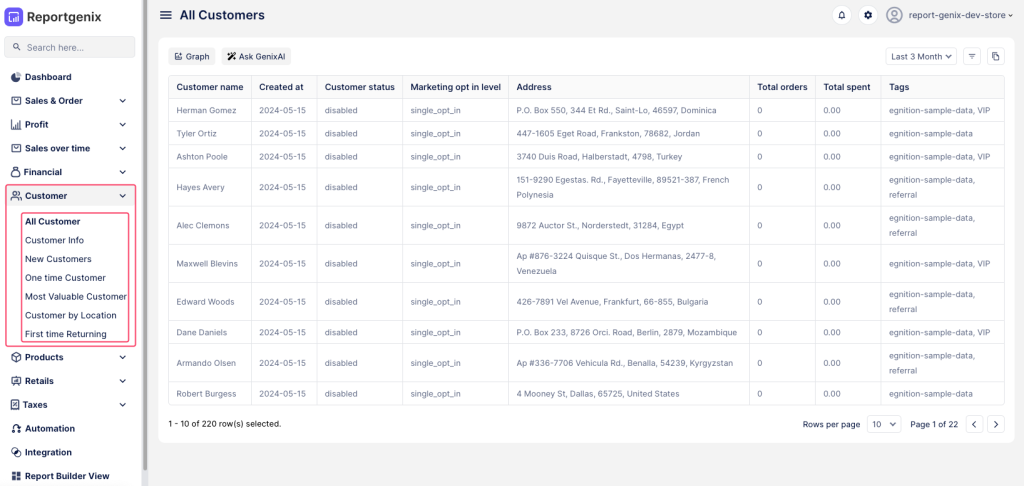
Get in-depth reports on customers of your store to track their purchasing behavior. This section is divided into 7 reporting categories. You can get info about All Customers, New Customers, One time Customer, Most Valuable Customer, and more.
Products
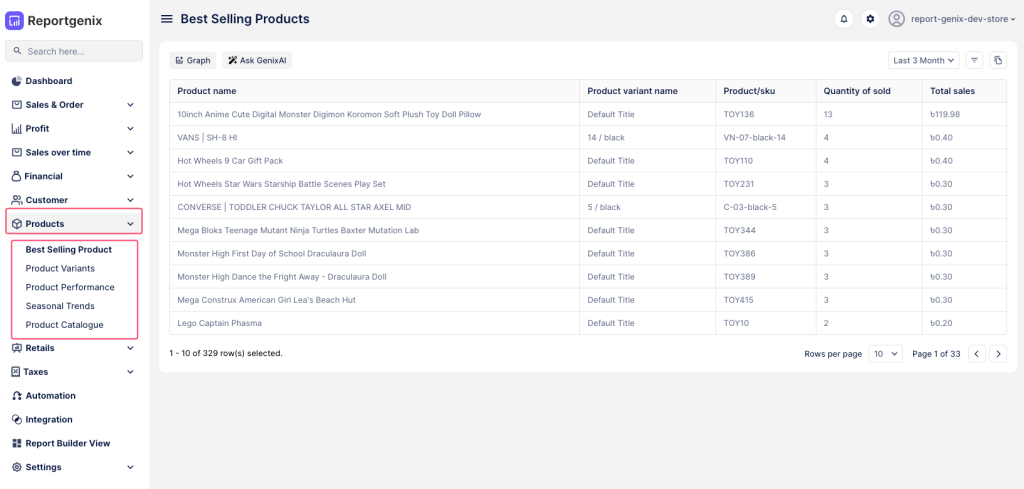
Shows the performance of individual products or product variants. You can identify the popular item of your store from this section. It shows product reports into criterias like- Best Selling Product, Product Variants, Seasonal Trends, etc.
Retails
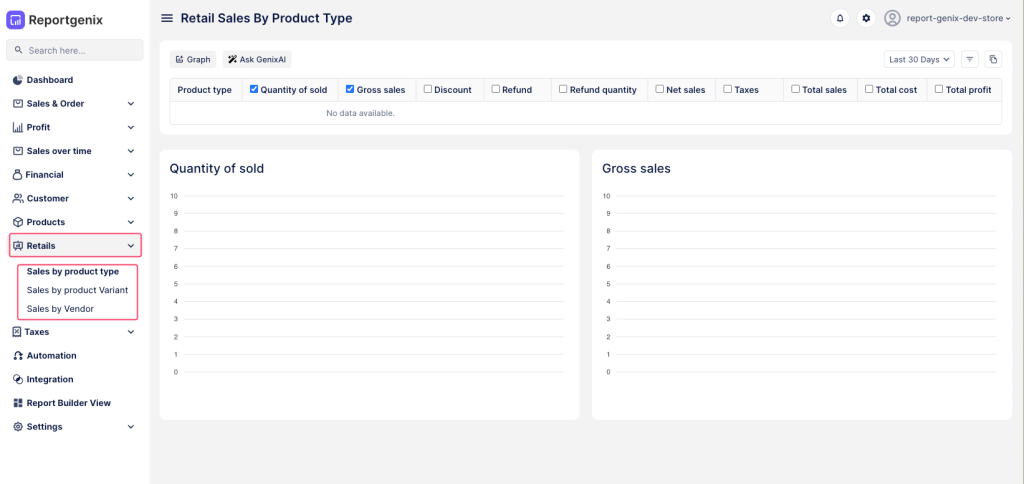
This section provides detailed sales reports for retail products, segmented into 3 categories. You can track sales by Product Type, Product Variant, and Vendor. Each category offers specific insights to help you understand your retail performance better.
Taxes
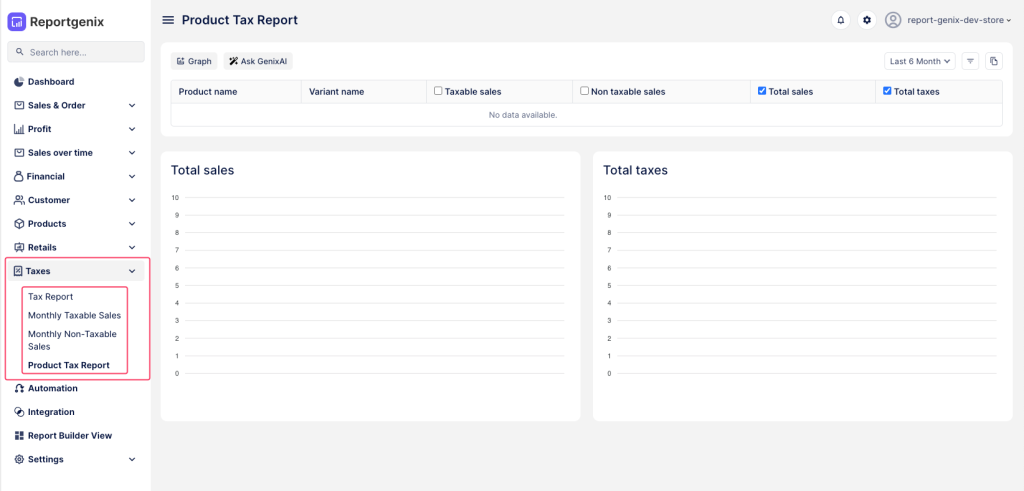
The Tax section consists of four categories: Tax Report, Monthly Taxable Sales, Monthly Non-Taxable Sales, and Product Tax Report. Each category gives you specific insights into your tax-related data for better financial management.
